Stock Market Graph
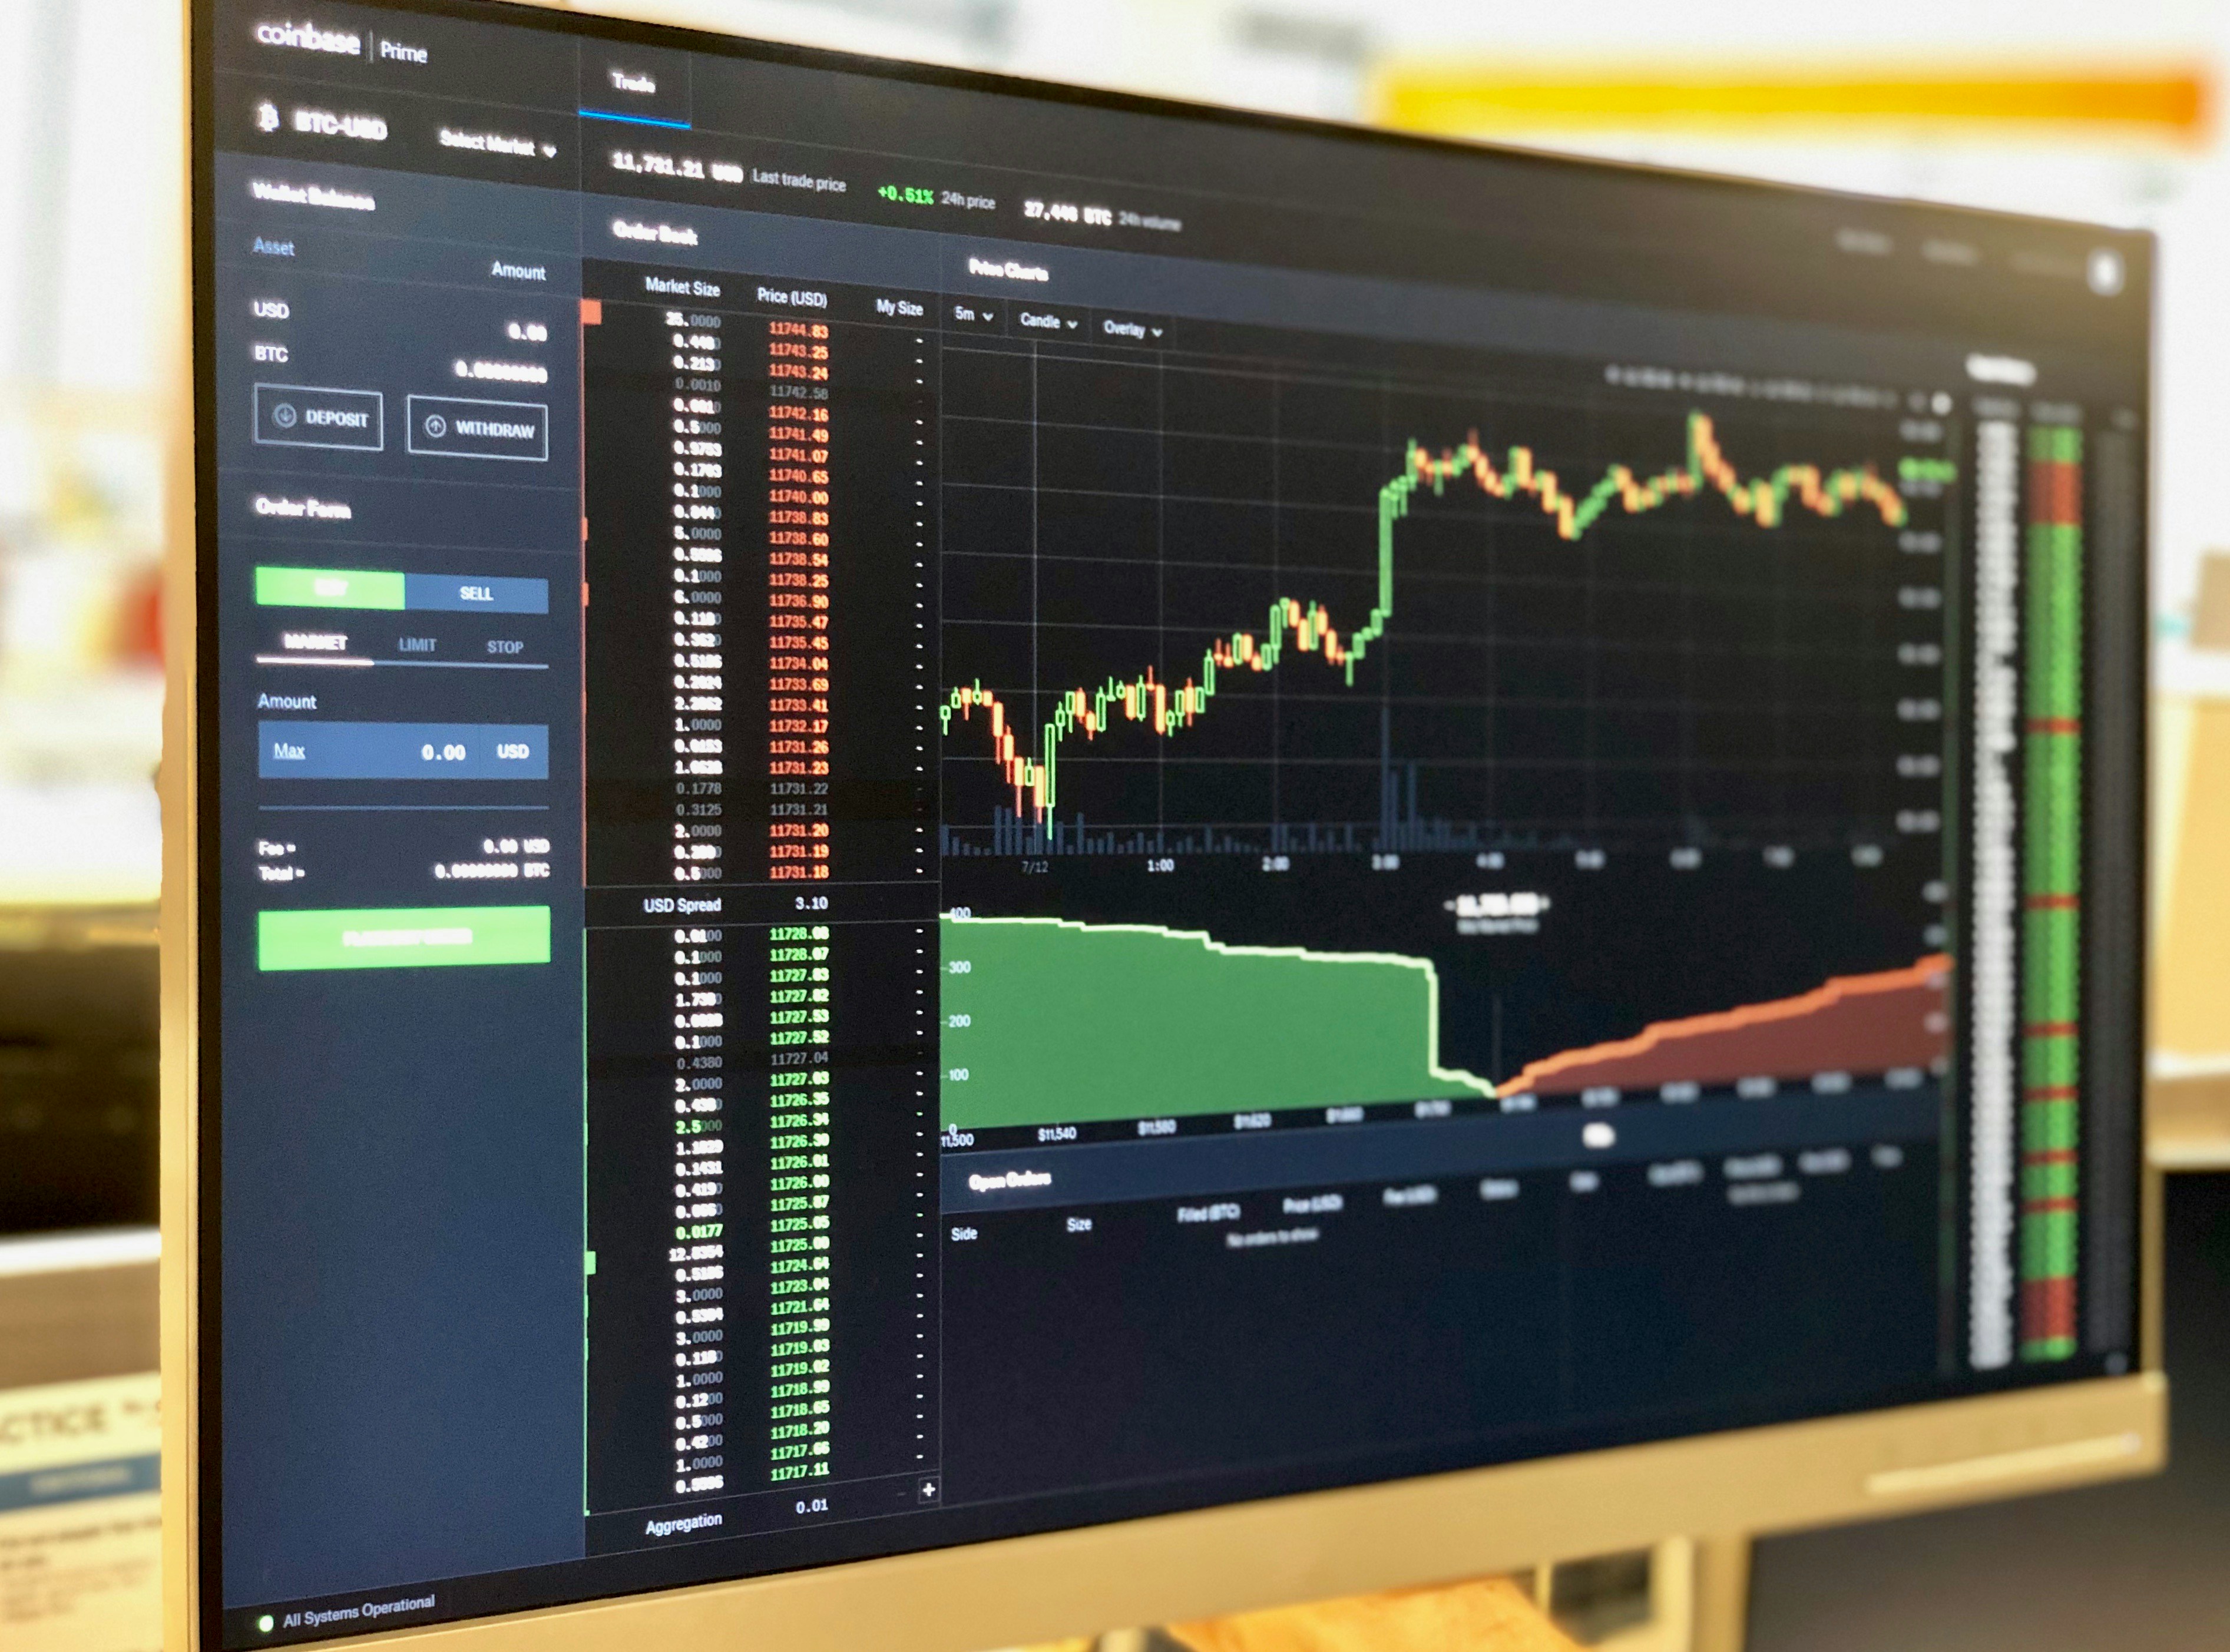
A stock market graph (or chart) visually shows a security’s price movement over time. Common chart styles include line charts, bar charts and candlestick charts. Volume bars show trading activity and help confirm price moves.
Reading the basics
- X-axis: Time (minutes, hours, days, months).
- Y-axis: Price (dollars or other currency).
- Candlesticks: Show open, high, low and close for a period — the “body” shows the open/close range and the wicks show highs/lows.
- Volume: Confirms strength of moves — higher volume gives more credibility to price moves.
Quick tips
Start with a single time-frame (daily for long-term investors; intraday for traders), look for trends, and learn a few common patterns (support/resistance, trendlines, moving averages) before adding more indicators.
See a beginner walkthrough: Investopedia — How to Read a Stock Chart and Investopedia — Candlestick Charts.


